编写收集 syslog 日志的 Logstash 配置文件
[root@linux-node2 ~]# cat /etc/logstash/conf.d/syslog.conf
input {
  syslog {
    type => "system-syslog"
    port => 514
  }
}

output {
  stdout {
    codec => rubydebug
  }
}
前台方式测试 Logstash 能正常收集 syslog 日志
# 确认 514 端口没有被占用

[root@linux-node2 conf.d]# netstat -lntup | grep 514

# 前台方式启动,输出到标准输出,先确保能收集

[root@linux-node2 conf.d]# /opt/logstash/bin/logstash -f syslog.conf
Settings: Default pipeline workers: 1
Pipeline main started

# 启动 logstash 后,可以看到在监听上面配置的 514 端口

[root@linux-node2 ~]# netstat -lntup | grep 514
tcp        0      0 0.0.0.0:514             0.0.0.0:*               LISTEN      40502/java
udp        0      0 0.0.0.0:514             0.0.0.0:*                           40502/java

# 分别在要收集 syslog 日志的服务器上配置 syslog,本文以 192.168.56.11,192.168.56.12 为例

[root@linux-node1 ~]# vim /etc/rsyslog.conf
*.* @@192.168.56.12:514			# 添加这一行

[root@linux-node1 ~]# systemctl restart rsyslog

# 重启后,会将服务器现有的 syslog 日志上传到 logstash
# 确认 logstash 前台运行时标准输出可以接收到 syslog 日志后,
# 我们再将 logstash 配置文件 syslog.conf 中的 output 部分修改如下(这样将收集到的 syslog 日志写入到 ES):

[root@linux-node2 ~]# cat /etc/logstash/conf.d/syslog.conf
input {
  syslog {
    type => "system-syslog"
    port => 514
  }
}

output {
  elasticsearch {
    hosts => ["192.168.56.12:9200"]
    index => "system-syslog-%{+YYYY.MM}"    # 数据量不大的情况下索引数量不能配置太多,否则索引和分片过多会影响性能
  }
}
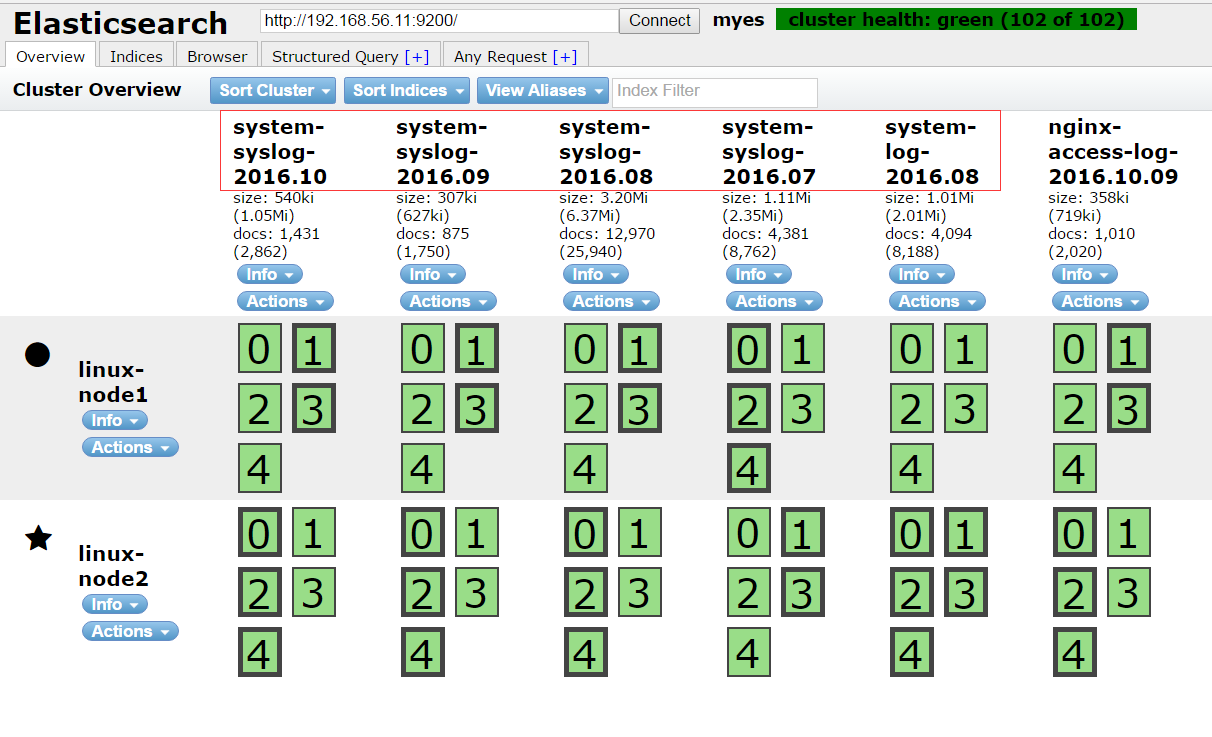
后台运行 Logstash,确认索引数据写入到 ES
重启运行 Logstash,然后在 ES head 插件中确认索引及数据是否写入。
Kibana 中配置索引
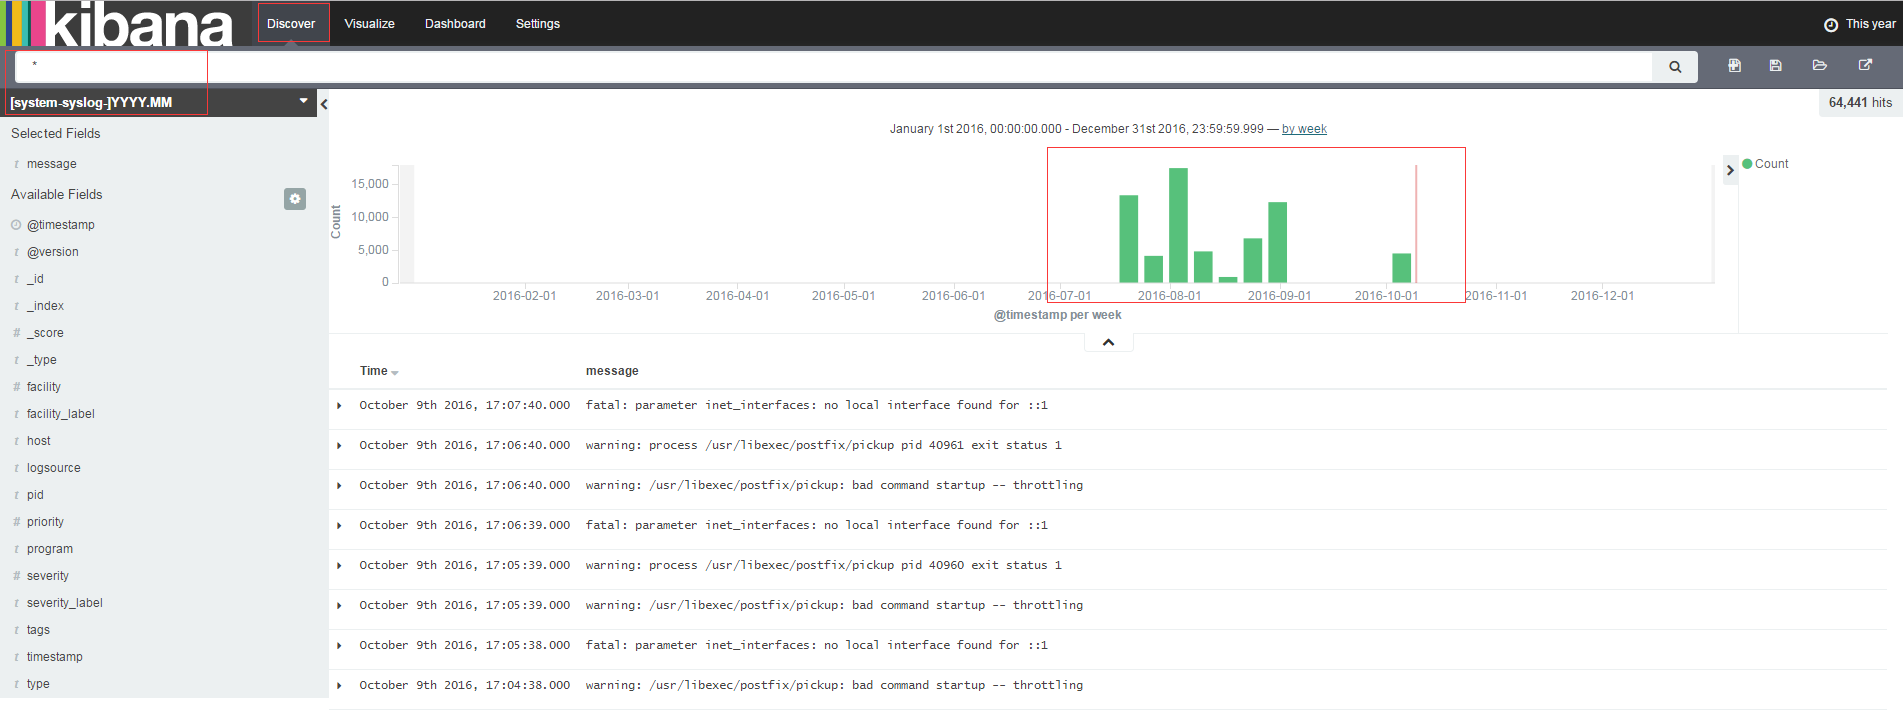
确认数据写入 ES 后,在 Kibana 中添加配置索引。
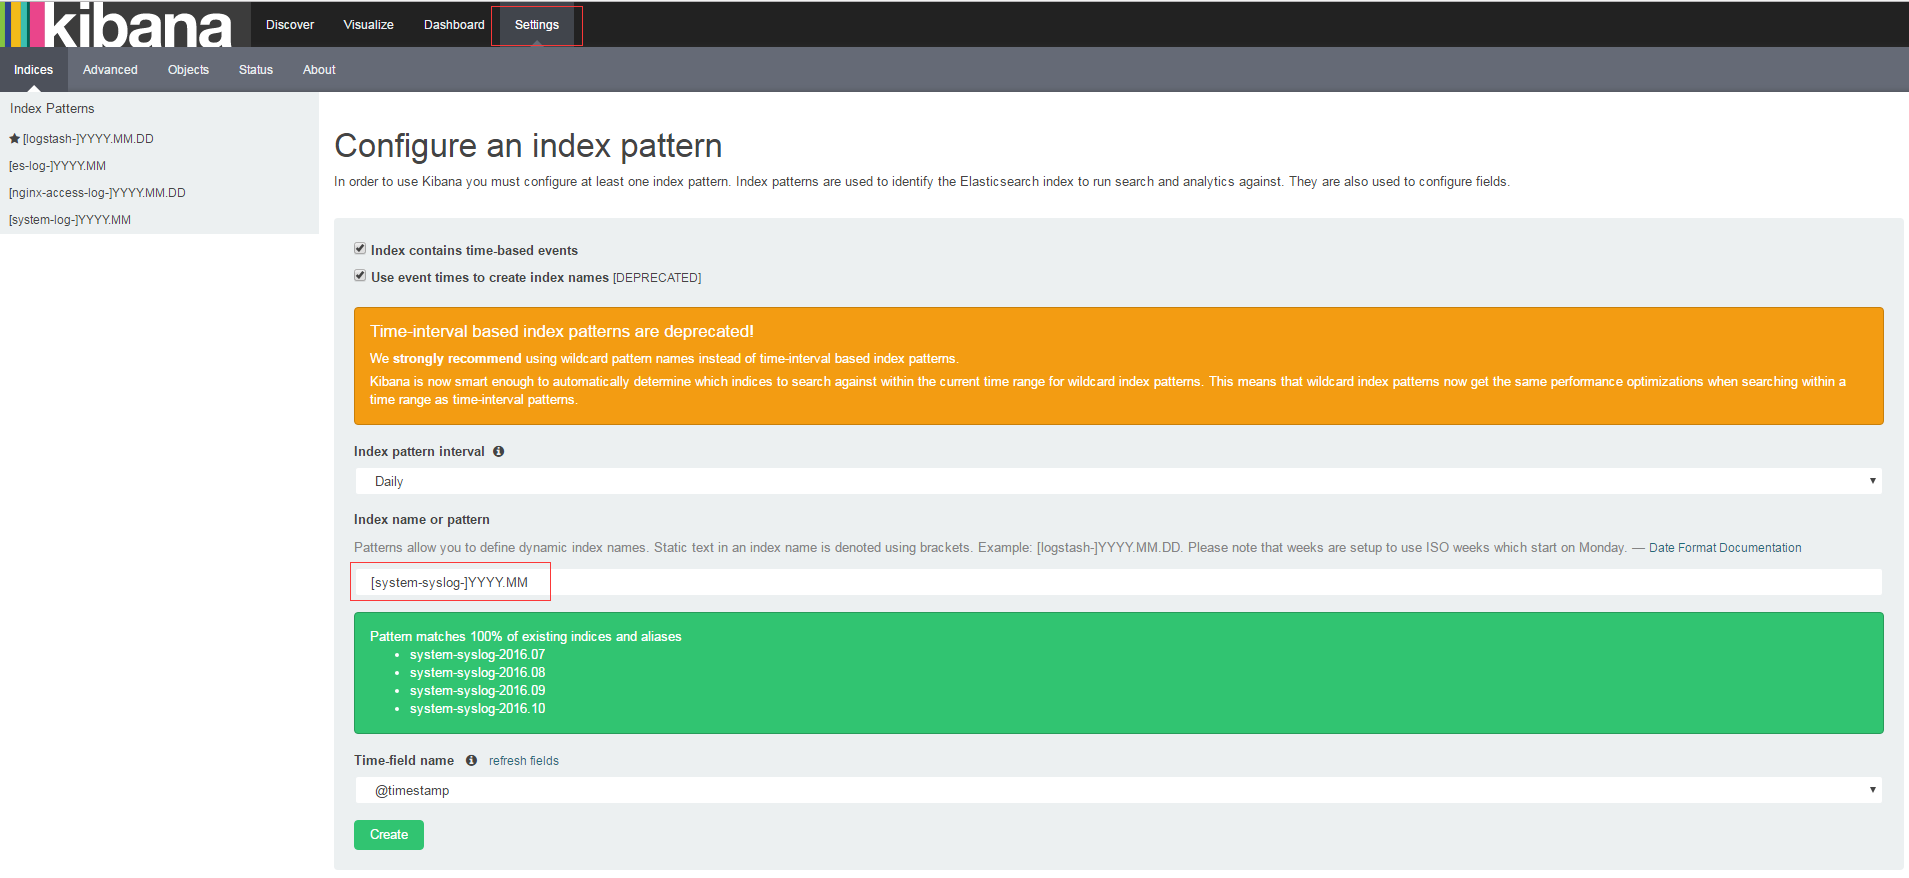
注意:如果一个索引中的字段有增加或减少需要刷新。
