ELK-使用消息队列进行扩展 Logstash
Logstash 支持消息队列
当我们在大规模的场景下收集日志时,很有可能收集日志的速度比日志写入 ES 中的速度快很多。
这时我们可以使用一个消息队列作为缓冲。
Logstash 支持的消息队列插件有 kafka/Redis/rabbitmq 等,可以用于 Input 或 Output 插件。
本文以 Redis 作为消息队列演示收集 Apache 访问日志。
1. Redis 安装配置
# 在 192.168.56.12 上安装 redis

yum install -y redis

# 配置 redis.conf 以下参数

vim /etc/redis.conf
daemonize yes
bind 192.168.56.12

systemctl start redis
netstat -lntp

# 连接 redis 进行测试

[root@linux-node2 ~]# redis-cli -h 192.168.56.12 -p 6379
192.168.56.12:6379> info
...省略输出...
192.168.56.12:6379> set test-key test
OK
192.168.56.12:6379> get test-key
"test"
192.168.56.12:6379> keys *		# 生产环境下不要这样列出所有 key
1) "test-key"
2. 在 192.168.56.11 前台运行 Logstash 测试收集数据并写入 Redis
[root@linux-node1 conf.d]# cat redis.conf
input {
   stdin {}
}

output {
  redis {
    host => "192.168.56.12"
    port => 6379
    db => 6
    data_type => "list"
    key => "demo"
  }
}

# 以上 output 部分使用 redis 插件将标准输入的数据写到 redis 中的 db:6 key:"demo",数据类型为 list

[root@linux-node1 conf.d]# /opt/logstash/bin/logstash -f redis.conf
Settings: Default pipeline workers: 1
Pipeline main started
test1	# 输入测试数据
test2
test3

# 在 192.168.56.12 上确认上面输入的数据写入到 redis

192.168.56.12:6379[6]> keys *
1) "demo"
192.168.56.12:6379> select 6
OK
192.168.56.12:6379[6]> type demo
list
192.168.56.12:6379[6]> llen demo
(integer) 3
192.168.56.12:6379[6]> lindex demo -1
"{\"message\":\"test3\",\"@version\":\"1\",\"@timestamp\":\"2016-10-11T08:21:58.531Z\",\"host\":\"linux-node1\"}"
3. 收集 Apache 访问日志写入到 Redis
# 修改配置 apache.conf 如下:

[root@linux-node1 conf.d]# cat apache.conf
input {
  file {
    path => "/var/log/httpd/access_log"
    start_position => "beginning"
  }
}

output {
  redis {
    host => "192.168.56.12"
    port => 6379
    db => 6
    data_type => "list"
    key => "apache-access-log"
  }
}

[root@linux-node1 conf.d]# /opt/logstash/bin/logstash -f apache.conf

# 然后我们浏览器访问 192.168.56.11 产生一些日志
# 再接着去 192.168.56.12 上 redis 确认 Apache 的访问日志是否写入

192.168.56.12:6379[6]> keys *
1) "apache-access-log"
2) "demo"
192.168.56.12:6379[6]> type apache-access-log
list
192.168.56.12:6379[6]> llen apache-access-log
(integer) 6
192.168.56.12:6379[6]> lindex apache-access-log -1
"{\"message\":\"192.168.56.1 - - [11/Oct/2016:16:35:50 +0800] \\\"GET / HTTP/1.1\\\" 304 - \\\"-\\\" \\\"Mozilla/5.0 (Windows NT 6.1; WOW64) AppleWebKit/537.36 (KHTML, like Gecko) Chrome/53.0.2785.143 Safari/537.36\\\"\",\"@version\":\"1\",\"@timestamp\":\"2016-10-11T08:35:51.169Z\",\"path\":\"/var/log/httpd/access_log\",\"host\":\"linux-node1\"}"
其实我们要实现收集的 Apache 访问日志的数据处理流向如下图所示:
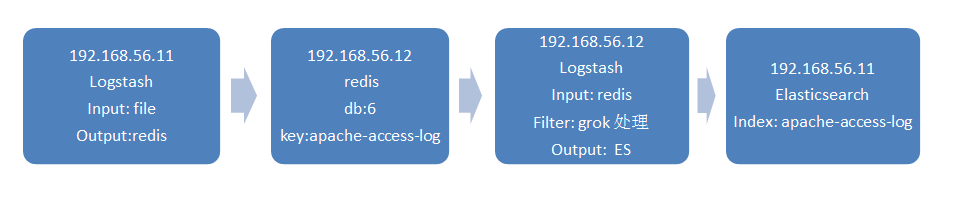
下面我们继续来完成上面的架构。
4. 读取消息队列 Redis 中的日志数据并进行 grok 处理
# 在 192.168.56.12 上配置前台启动 logstash 测试
# 先测试 output 到标准输出

[root@linux-node2 conf.d]# cat indexer.conf
input {
  redis {
    host => "192.168.56.12"
    port => 6379
    db => 6
    data_type => "list"
    key => "apache-access-log"
  }
}

output {
  stdout {
    codec => rubydebug
  }
}

[root@linux-node2 conf.d]# /opt/logstash/bin/logstash -f indexer.conf
Settings: Default pipeline workers: 1
Pipeline main started
{
       "message" => "192.168.56.1 - - [11/Oct/2016:16:35:48 +0800] \"GET / HTTP/1.1\" 304 - \"-\" \"Mozilla/5.0 (Windows NT 6.1; WOW64) AppleWebKit/537.36 (KHTML, like Gecko) Chrome/53.0.2785.143 Safari/537.36\"",
      "@version" => "1",
    "@timestamp" => "2016-10-11T08:35:49.126Z",
          "path" => "/var/log/httpd/access_log",
          "host" => "linux-node1"
}
...省略其他输出...

# 从上面可以看到,Logstash 读取到了 redis 中的日志数据并输出到了标准输出

# 下面继续修改 indexer.conf 增加 filter grok 插件来处理 Apache 访问日志

[root@linux-node2 conf.d]# cat indexer.conf
input {
  redis {
    host => "192.168.56.12"
    port => 6379
    db => 6
    data_type => "list"
    key => "apache-access-log"
  }
}

filter {
  grok {
    match => { "message" => "%{COMBINEDAPACHELOG}" }
  }
}

output {
  stdout {
    codec => rubydebug
  }
}

# 我们浏览器访问 192.168.56.11 再来产生一些日志

[root@linux-node2 conf.d]# /opt/logstash/bin/logstash -f indexer.conf
Settings: Default pipeline workers: 1
Pipeline main started
{
        "message" => "192.168.56.1 - - [11/Oct/2016:17:07:58 +0800] \"GET / HTTP/1.1\" 304 - \"-\" \"Mozilla/5.0 (Windows NT 6.1; WOW64) AppleWebKit/537.36 (KHTML, like Gecko) Chrome/53.0.2785.143 Safari/537.36\"",
       "@version" => "1",
     "@timestamp" => "2016-10-11T09:07:58.900Z",
           "path" => "/var/log/httpd/access_log",
           "host" => "linux-node1",
       "clientip" => "192.168.56.1",
          "ident" => "-",
           "auth" => "-",
      "timestamp" => "11/Oct/2016:17:07:58 +0800",
           "verb" => "GET",
        "request" => "/",
    "httpversion" => "1.1",
       "response" => "304",
       "referrer" => "\"-\"",
          "agent" => "\"Mozilla/5.0 (Windows NT 6.1; WOW64) AppleWebKit/537.36 (KHTML, like Gecko) Chrome/53.0.2785.143 Safari/537.36\""
}
...省略其他输出...

# 从上面可以看到,Logstash 读取到了 redis 中的日志数据,进行 grok 过滤处理后再输出到标准输出
5. 将 grok 过滤处理后的日志数据写入到 ES
# 下面继续修改 indexer.conf,修改 output 写入到 ES,最终如下:

[root@linux-node2 conf.d]# cat indexer.conf
input {
  redis {
    host => "192.168.56.12"
    port => 6379
    db => 6
    data_type => "list"
    key => "apache-access-log"
  }
}

filter {
  grok {
    match => { "message" => "%{COMBINEDAPACHELOG}" }
  }
}

output {
  elasticsearch {
    hosts => ["192.168.56.11:9200"]
    index => "apache-access-log-%{+YYYY.MM.dd}"
  }
}

[root@linux-node2 conf.d]# /opt/logstash/bin/logstash -f indexer.conf


# 产生一些 HTTP 200 访问日志

ab -n 1000 -c 10 http://192.168.56.11/

# 然后去查看上篇文章已经配置过的 Apache 状态码饼图,确认数据是否更新
Kibana Dashboard 可以设置自动刷新。
